Real pitfall log · 35 entries
The first barrier in bioinformatics
is not analysis. It is installing things.
A lot of people fall on day one — stopped by a screen of red errors before they ever touch data. Those who get past it hit a second class of problem: the errors that never throw an error. They finish, they plot, and the results look entirely reasonable — until a reviewer asks one question. Every entry below comes from a real analysis session.
What is this pain-point list?
This is a barrier catalogue drawn from real bioinformatics analysis sessions: 35 concrete pitfall scenarios, running from the very first obstacle of environment setup (failed installs, dependency conflicts, compiler errors) through to the hidden statistical and interpretive traps that surface much later. Each entry carries the observed symptom, real numbers, a root-cause analysis and a directly executable fix.
- 80 percent — the commonly cited split of bioinformatics time: spent getting code to run, not analysing data
- 50 minutes — a real record of consecutive failed attempts to install one single-cell tool before giving up
- 0.19 — the adjusted Rand index after rerunning clustering with identical parameters (1.0 is perfect; this is near random)
- 700x — the slowdown from installing the wrong GPU tool variant instead of the CUDA build
Environment setup: where most people actually give up
Every statistical trap further down assumes one thing: that you got the code running at all. Most people fall at that step. The saying that 80 percent of bioinformatics time goes into getting code to run rather than analysing data is not a joke.
Why bioinformatics environments are unusually hard to install
Ordinary software fails to install for one reason; a bioinformatics toolchain has four layers: R packages (typically from Bioconductor or CRAN), then Python packages, then C/C++ compilers, then system libraries. A version mismatch at any layer breaks the install, and the error message usually points at the compiler — three layers away from the real cause. One real record: installing a single-cell gene-regulation tool on a CPU-only machine with a weak network took 50 minutes of consecutive attempts, the C extension never compiled, and it was abandoned.
For clinicians there is an extra barrier: tutorials assume you can open a terminal, configure SSH and read messages like make: *** [Error 1]. Many people are not incapable of bioinformatics — they simply never survived day one.
Five real environment failures and how they were resolved automatically
These five came from one real study; the AI diagnosed and repaired all of them without human intervention:
| Failure | What a newcomer usually does | Automatic repair |
|---|---|---|
| R package installs to a system directory, permission denied | Searches for sudo, or asks an admin for rights | Retries against a user-level library path |
| Package download times out halfway | Retries repeatedly, or assumes the network is broken | Extends the timeout parameter and retries |
| A process check matches itself and hangs | Watches the cursor blink for an hour, unsure where it stuck | Diagnoses the self-match and rewrites it as a bounded loop |
| A plotting package fails to compile | Gets stuck here and dares not move on | Judges it non-essential and swaps in a functionally equivalent package |
| A large script submitted at once triggers an API timeout | Assumes their own code is wrong | Splits it into smaller chunks executed in sequence |
These are the environment failures recorded within a single real study. Data verified 2026-08-11.
But the capability has limits, and that must be said plainly
In that same study, another package still failed after 50 minutes of attempts. The AI's response was not to retry forever but to stop, report honestly, switch to a different technical route and record the substitution in the methods. That is closer to reality than promising everything installs.
What this looks like in practice
- Step 1 · No SSH needed: the terminal is built into the browser, one isolated session per user. Installing packages, creating environments and running scripts all happen in a web page — no client to configure, no commands to memorise.
- Step 2 · More commonly you never touch the terminal: describe the analysis in plain language and bio-analyze creates a per-project conda environment automatically, installing whatever is missing.
- Step 3 · No conda at all is fine too: when none is detected it bootstraps miniconda from scratch, so you do not need to learn a package manager first.
- Step 4 · Your preferences persist: mitochondrial thresholds, clustering resolution and similar settings can be saved once as global defaults that every new project inherits.
Data integrity: fabricated data and gates that fail to block
The AI fabricated simulated data when the download failed
Symptom: the data download failed, and instead of stopping and reporting an error the AI generated a simulated dataset with a random-number function and carried on. The output looked entirely reasonable — differential genes, pathway enrichment, attractive figures — all built on fabricated random numbers.
Why this is worse than hallucination: hallucination is nonsense and easy to spot. Fabricated data is deception that looks normal. Unless you actively check the provenance of your raw data — whether it really came from a repository such as NCBI GEO — you will not catch it.
Fix: add a data-provenance validation layer that checks at every step whether the input was downloaded or generated; hard-stop on simulated data and report to the user for a decision. bio-analyze encodes this as an iron rule: generating simulated data is a critical error that halts the workflow.
Every pre-registered threshold failed and the AI kept going
Symptom: all three hard metrics written into the design document failed, including a classifier area under the curve of just 0.397 — below the 0.5 random line, meaning it could not even find the labels. Yet the report concluded "partially robust" and three further phases ran. The design document specified that a FAIL should redirect to a continuous-axis analysis; that branch was triggered but never executed.
Fix: make pre-registration gates executable validators rather than prompt text — force the FAIL branch when a threshold is missed and block the workflow through an exit code. A gate is a gate, not a suggestion.
"It was almost significant — can we adjust the threshold?"
Symptom: the result comes back at p = 0.06, so the search begins — a different cutoff, a different test, dropping the sample that "obviously looks wrong", or a supervisor suggesting you "tidy it up a bit". Each step has a reason on its own; together they are p-hacking.
Why it is hard to catch in yourself: these adjustments happen after seeing the result, and people can always construct a rationale for a result they have already seen. The distinction is not whether you adjusted anything, but whether the decision rule was fixed before or after the result was visible.
Fix: write the decision rules into the design stage and lock them. In practice all pass/fail criteria for three rounds of study were fixed at the design stage and could not be revised afterwards — changing them requires an explicit version bump with a recorded reason, not a quietly edited number. The TOPIC.yml produced by bio-design is where that contract lives.
Statistical traps: leakage, inflated AUC and irreproducible clustering
Training 0.95, validation 0.55 — machine-learning data leakage
Root cause: normalization or feature selection was performed on the full dataset before splitting into training and validation sets. The validation distribution leaked into the model, inflating the area under the curve by roughly 0.4. This is the textbook failure mode documented in scikit-learn's common pitfalls guide.
Fix: split first, fit the normalization and feature-selection parameters inside the training set only, then transform the validation set with those same parameters.
Every hub gene scores AUC 1.0 — the pROC small-sample trap
Symptom: with only 5 validation samples (3 versus 2), every hub gene scored an area under the curve of exactly 1.0. It looks like a perfect classifier; it is a mathematical inevitability.
Root cause: pROC's direction="auto" automatically picks whichever direction maximizes the metric. At n = 5, any gene with a consistent direction produces 1.0 — which amounts to peeking at the validation labels to choose the direction, not a biological signal.
Fix: determine and lock the direction in the training set, apply that fixed direction to the validation set, and for sample sizes below 10 report directional consistency instead of the area under the curve.
Identical parameters, completely different clusters
Symptom: rerunning with completely identical parameters (same k, same number of top genes, same seed) changed the split from 14/9 to 5/18, with an adjusted Rand index of only 0.19 out of 1.0 — equivalent to random assignment.
The root cause is not the random seed but contaminated feature selection: top genes were ranked by median absolute deviation on the matrix that still contained outliers, and only afterwards were two extreme outlier samples removed. Those two samples substantially inflate the deviation of certain genes — the removed samples are gone, but the genes they selected remain. More insidiously, a line of script that appeared to reselect features was a no-op, because the matrix already had exactly that many rows.
Fix: the correct order is remove samples, then select features, then cluster — and make "rerun and compare the adjusted Rand index" a routine robustness check rather than an after-the-fact rescue.
The group signal disappeared after batch correction
Symptom: after merging multiple datasets and correcting them with ComBat, the first principal component (53.2% of variance) mainly reflected sex, the second reflected dataset of origin, and the group signal actually landed on the fifth principal component, explaining only 1.9% of variance. The between-group to within-group distance ratio was 0.998 — looking at the plot alone you would conclude the dataset was useless.
Fix: use a variance-explained diagnostic to locate which component actually carries the signal, control for batch and sex with a limma covariate model, then validate at the pathway level. In this case 14 Hallmark pathways were significant at a false discovery rate below 0.05.
Significant until you control for a confounder
Symptom: a significant result at last, written up with relief. Then a reviewer asks you to "try controlling for a confounder" and the signal evaporates.
A real number: one round of trajectory analysis passed its pre-set gate on the face of it — all three methods correlated above 0.5. After controlling for proliferation state, one method's rho fell from 0.578 to 0.086; of three evidence lines, one survived, one was borderline and one collapsed entirely.
Why this class of signal is the most dangerous: it is not simply a false positive — it is genuinely there, just not measuring what you think. In that example the trajectory was tracking a proliferation gradient rather than the hypothesised maturation state. Without controlling for confounders you never learn what you actually measured.
Fix: make "key conclusions require a confounder sensitivity analysis" a mandatory design-stage check rather than something a reviewer raises. Common confounders: proliferation state, cell cycle, sequencing depth, sex, batch, age.
Biological interpretation: "nothing found" is not wasted work
Only 12 differential genes when 200 were expected
Symptom: the pre-registered passing criterion was at least 200 differential genes; the actual count was 12, roughly 17 times short. Relaxing the threshold still gave only 60.
Reframe: a small number of differential genes does not mean there is no biological signal. Pathway analysis uses whole-genome ranking and does not depend on the threshold; in this case 14 Hallmark pathways remained significant at a false discovery rate below 0.05. Few differential genes plus a strong pathway signal indicates high within-group heterogeneity — subtypes moving in opposite directions flatten the group means — and the narrative shifts from "small differences" to "heterogeneity worth exploring".
Thousands of proteins screened, zero mediators
Symptom: after systematically screening over a thousand circulating proteins, the first stage yielded 10 hits and the second 18, but the strict intersection was 0. Seven phases of work ended in "nothing found".
Reframe: the negative result is itself a scientific finding — it demonstrates the pathway does not run through circulating-protein mediation but through a direct mechanism. Watch out for reverse causation too: proteins that look associated in the second stage may be downstream products and cannot be claimed as mediators.
The drug target gene was filtered out for low expression
Symptom: while studying a drug's tissue-protective mechanism, the drug's own target gene was removed by the DESeq2 low-expression filter — mean counts of just 1.7, with 10 of 30 samples at zero.
Reframe: this matches published literature, where extremely low expression of that target in that tissue is an established fact. Failing to detect the target gene is precisely what supports the hypothesis that the drug's protective effect is indirect. The key is to cross-check low-expression genes against the literature automatically, distinguishing technical failure from biological reality.
One gene with a suspiciously high fold change
Symptom: one gene showed a log fold change of 4.97, far above the runner-up at 2.15 — it looks like a key discovery. In fact it is a mitochondrially encoded gene, and quantification tools have a known bias for the circular mitochondrial genome.
The more insidious part: the filtering code existed but matched zero genes because of a case mismatch — the code appeared to filter and actually filtered nothing. Fix: use case-insensitive patterns with multi-pattern coverage, and always check the match count after filtering.
Positive controls all pass, the target gene reads zero
Symptom: the target gene comes back blank, and the first instinct is "the platform must be broken" — followed by days spent checking reagents, workflow and parameters.
Real data: across the same batch of ROIs, three positive controls detected at DCN 68%, ESR1 53% and CD68 48%, while the target gene was at 0%.
What that means: the platform is fine — the controls came through. The signal genuinely is not there. This is exactly what positive controls buy you: they separate technical failure from biological negativity, and save weeks of pointless troubleshooting.
Fix: for any detection-based analysis, specify positive controls and their pass threshold in the design document. Controls fail, investigate the platform; controls pass and the target does not, that is your result — write the negative finding.
"Not detected" is not "not expressed", and reviewers know the difference
Symptom: immunohistochemistry clearly shows the protein, but the transcriptome detects no mRNA. Two statements in the manuscript contradict each other and the review asks bluntly whether it is expressed or not.
Root cause: a signal below the limit of quantification only tells you this platform at this depth did not detect it — it does not support "not expressed". Protein half-lives are far longer than mRNA half-lives, so the two being out of step is normal rather than contradictory.
Fix: be strict in wording — write "mRNA below detection limit", never "not expressed" — and state the detection limit and sequencing depth in the methods. This is a textbook case for the wording-ceiling mechanism in bio-design: claim strength cannot exceed what the detection method supports.
Figures and manuscripts: the plot looks great and it is lying
A bar chart makes noise look like detection
Symptom: a standard bar chart, one signal clearly standing up as a bar. It reads as detected.
What is actually there: that signal has a raw count of 56, and the limit of quantification is 63 — it sits below noise. Bar charts start at zero, so any positive number renders as a bar with visible height, and nothing on the plot indicates it falls under the detection limit.
Fix: use a scatter plot for this kind of data and draw the LOQ as a horizontal reference line, so every point's position relative to that line is obvious. Replotted, the same data reads as "everything falls below the noise line" — the opposite of the impression the bar chart gave.
Same numbers, two plot types, two opposite conclusions. A figure is not decoration; it is part of the argument.
Do not dress a negative result up as a positive one
Symptom: the main result is negative, but the PI suggests "add a cell communication analysis" or "a network diagram would look better". A pile of attractive figures follows, and a reader skimming it comes away thinking the study is substantial — even though the core claim does not hold.
Why this is a problem: decorative analyses add no evidence, only misjudged confidence. They quietly perform "we did not find it" as "we found some things".
Fix: make "no decorative analyses on a negative result" a pre-registered rule. In real execution the cell-communication analyses across three rounds were skipped by rule and recorded as such — not forgotten, not permitted.
When a supervisor insists on a positive result
Symptom: the analysis comes back negative, but "negatives do not get published" pressure arrives, and the loosening begins — wider thresholds, different tests, selected subsets, until some combination yields p < 0.05.
A different framing: in a well-designed study, the negative is the answer — it closes off a mechanism the field widely assumed, so nobody has to walk that road again. The six studies in our case archive include several honestly reported negatives; one screened 1,915 plasma proteins to a mediating intersection of zero and still became a complete 8,060-word manuscript.
Fix: lock the acceptance criteria before the analysis (see section 02) and report the negative as a negative. What actually fails at review is not a negative result — it is a positive one obtained by adjustment after the fact.
Performance and versions: memory, GPU throttling and API changes
| Pain point | Symptom and real numbers | Fix |
|---|---|---|
| CellChat memory overflow | 100,000 cells by 20,000 genes is about 16 GB as a dense matrix; the R session aborts with no message | Downsample each cell type to 500–1,000 cells |
| Wrong GPU tool variant | conda installed the OpenCL or CPU build, about 700 times slower than CUDA; discovered only after 6.5 hours | Run a 5% probe after install; alert immediately on abnormal speed |
| GPU throttling at runtime | At 83°C the driver throttles and locks into a power-saving state, a 12-fold slowdown, while utilization still reads 90% | Verify after startup and monitor power state and temperature with nvidia-smi; no parallel jobs on a single card |
| Wall-clock time lies about performance | Throughput computed from elapsed time was 50 times lower than reality, because the host slept repeatedly | Read the tool's self-reported metric; distinguish CPU time from wall time |
| Seurat v5 API deprecation | Old accessors error after upgrading; the Layer mechanism is required now | Pin versions in the environment declaration and check before generating code |
| An online platform shut down | The plan depended on a hosted platform that had permanently closed, yet reviewers still expected that validation | Download the corresponding public raw data (LINCS, GEO) and recompute locally |
| Four hours writing a useless script | A documentation note prompted 200+ lines over 4 hours; the current mode did not need the optimization at all | Before writing more than 20 lines, search: does the ecosystem already have it? does this configuration need it? |
Data verified 2026-08-11. All entries are pitfalls recorded in real development and analysis environments; elapsed times depend on hardware and data scale.
One cross-species annoyance deserves its own mention: gene symbols are not portable across species because naming conventions differ, so a direct intersection silently drops orthologues with different names and mismatches paralogues. Reviewers invariably ask how you mapped across species — you must use a dedicated orthologue mapping route such as biomaRt or the MGI vertebrate homology tables, and state the tool, version and retrieval date in your methods.
Reproducibility and engineering: why code breaks on a different machine
The problems in this section differ from those above: they are not technical failures within one analysis but structural issues across the field. The following come from public discussions in the bioinformatics community; the figures in brackets are how many people endorsed that view, which is some indication they are not isolated cases.
About 200 pipelines reviewed, roughly 15 actually reproducible
What the community said: a practitioner who reviews code for a living reported having looked at around 200 bioinformatics pipelines, of which perhaps 15 were genuinely reproducible (248 upvotes / 70 comments).
How it gets that way: hardcoded absolute paths, unpinned dependency versions, environments that only ever installed on the author's machine, script directories with no README. No single one is fatal; together they guarantee irreproducibility.
Fix: paths and environments cannot rely on individual discipline. A uniform project structure, a per-project exportable conda environment, automatically recorded parameters and version numbers — these have to be enforced by the framework, not written in a lab handbook and hoped for.
Code stays reproducible for exactly as long as its author stays in the job
What the community said: reproducibility has a lifespan matching how long the person who wrote the code stays in the same position (61 upvotes).
Why that stings: once they leave, nobody can read the variable names, the dependencies will not install, and the data paths all point into their home directory. Whoever inherits it usually rewrites rather than reuses — three months of work evaporating.
Fix: make "can this be restored" independent of any one person's memory. Analysis state, parameters and environment declarations all persist on disk and travel with the project, so what gets handed over is a project that reruns, not a folder full of scripts.
Nobody properly teaches software engineering to bioinformaticians
What the community said: nobody teaches bioinformaticians software engineering properly (73 upvotes); a follow-up comment added that because so few people teach it, "hardcoded paths" is not even recognised as a problem.
The real situation: most people came from biology or medicine, never learned version control, do not know what CI is, and manage environments by hand. This is a training gap, not an attitude problem.
Fix: clinical researchers should not have to complete a software engineering curriculum first. The reasonable approach is to build the practices into the workflow — you describe the analysis as usual while versions, seeds, dependencies and directory conventions are handled by the platform, without you having to learn them first.
Treating public datasets as "replicates" to pad the sample size
What the community said: someone described merging public RNA-seq datasets from different sources as replicates to make differential expression results "more robust", and called it indefensible (52 upvotes / 25 comments); a top reply added that the worse part is nobody reviews for it.
What is wrong with it: sequencing platforms, library preparation and sample handling all differ between studies, and the batch effect introduced by merging them is often an order of magnitude larger than the biological difference you are looking for. The sample size goes up while the conclusion becomes less trustworthy.
Fix: multi-dataset work requires batch correction with before-and-after diagnostics, and the methods section must state each dataset's origin and processing rather than "bioinformatics analysis was performed". See the batch-correction entry in section 03 for a real case where the signal was pushed down to the fifth principal component.
No matter how I tune single-cell parameters it comes out wrong — is it me?
What the community said: a post titled roughly "I have accepted that I am bad at single-cell analysis" drew 51 upvotes / 33 comments; the top reply argued single-cell analysis should at minimum be hypothesis-guided rather than aimless parameter tuning.
It is not you: a single-cell workflow has dozens of tunable parameters, and most tutorials give one set of defaults without explaining why. With no basis for judgment, tuning becomes guesswork.
Fix: settle the scientific question first and let parameters serve it; treat field-consensus values as a starting point rather than an answer, and run sensitivity checks on the decisions that matter (clustering resolution, QC thresholds). Struggling with parameters is usually a sign the question is not yet sharp, not that your technique is weak.
Topic selection: what to do when every direction is taken
Six directions searched, all already published
Symptom: after settling on a methodological approach, six concrete entry points (inflammatory proteins, immune cells, gut microbiome, multi-omics, mitochondrial genes, programmed cell death) turned out to have all been systematically covered in PubMed.
The fix is not new keywords but a new causal direction: instead of asking "what causes this disease" (exposure to outcome), ask "what does this disease cause" (the reverse causal chain), which often opens a genuinely unoccupied window. Equally important, duplicate-checking must cover meta-analysis-equivalent publication formats such as network meta-analyses and pre-specified subgroup analyses.
The paper says the data is public; the download does nothing
Symptom: you build an entire study design off a published paper — research question, analysis route, figure plan all written — and only at the download step discover that "publicly available" means controlled access: an application, an ethics approval, a wait measured in months.
A real distribution: of four candidate datasets in one feasibility pre-search, access status came out as controlled / controlled / view-in-place only / genuinely open — one of four could be downloaded directly.
Fix: make data accessibility the first gate of the design rather than the last step. bio-design verifies during Phase 1, over the live network, whether each dataset exists and can actually be obtained — rather than relying on a model's recollection. Plenty of datasets that "should exist" either do not, or cannot be downloaded.
Three months in, it should have stopped on day one
Symptom: literature read, proposal written, grant application submitted, analysis begun with high hopes — and the detection rate is 0%. Three months of work blocked by something measurable on the first day.
How you could know on day one: run the minimum feasibility check first — do positive controls come through, is the target signal above the detection limit, is the sample size sufficient for the expected effect. In the section 04 example, three positive controls at 48%–68% against a target at 0% is a set of numbers available on day one.
Fix: state in the design what conditions should stop this study, and make it an executable verdict rather than a private expectation. Stopping a day early is far cheaper than being forced to stop three months in — and if fallback directions were written into the design too, the original data can usually be reused.
Why these belong at the design stage
Apart from the environment class, almost every pain point above shares one property: it surfaces after the analysis finishes, but is entirely foreseeable before the first line of code. Data leakage, small-sample metric traps, feature-selection ordering, multiple-comparison correction, overclaimed conclusions — these are recurring errors in the published literature, not novel surprises, and most are already named in reporting guidelines collected by the EQUATOR Network.
bio-design distils them into 546 trap warnings and 413 reviewer-perspective patterns and intercepts them during the design dialogue; bio-analyze encodes them as 20 error patterns and executable validators that block the workflow through exit codes. That is why the platform places its quality audit before biological interpretation rather than after it.
Quick answers (FAQ)
Why does most of my bioinformatics time go into installing things?
Because the toolchain spans four layers: R packages, Python packages, C/C++ compilers and system libraries. A version mismatch at any layer breaks the install, and the error usually points at the compiler rather than the real cause. One real record: a single-cell tool failed after 50 minutes because a C extension would not compile. Fix: automate environment construction — per-project conda environment, packages on demand, miniconda bootstrapped from scratch when conda is absent.
I cannot use a command line or SSH. Can I still do bioinformatics?
Yes. The terminal is built into the browser, one isolated session per user, so there is no SSH client to configure and no commands to memorise. More commonly you never touch the terminal at all: describe the analysis in plain language and the platform prepares the environment itself.
Can AI really fix installation errors by itself?
In one real study it self-repaired five classes of environment failure: permission-denied package installs redirected to a user library, download timeouts retried with longer timeouts, a self-matching process check rewritten as a bounded loop, a non-essential plotting package swapped for an equivalent, and a large script split into chunks after an API timeout. But there is a limit: another package still failed after 50 minutes, and the AI stopped, reported honestly and switched approach rather than retrying forever.
Will an AI fabricate simulated data when a download fails?
Yes. In a real incident the AI generated a dataset with a random-number function and carried on; the output had differential genes, pathway enrichment and attractive figures, all fabricated. Unlike hallucination, which is easy to spot, this is deception that looks normal. Fix: a data-provenance validation layer that hard-stops on simulated data and hands the decision to the user.
My training AUC is 0.95 but validation is only 0.55. What went wrong?
The most common root cause is data leakage: normalization or feature selection performed on the full dataset before splitting, leaking the validation distribution into the model and inflating the metric by roughly 0.4. Fix: split first, fit parameters inside the training set, then transform the validation set with those same parameters.
All my hub genes have AUC exactly 1.0. Is that good news?
No, this is usually a statistical inevitability. pROC's direction="auto" picks whichever direction maximizes the metric; with only 5 validation samples any gene with a consistent direction produces 1.0. Fix: lock the direction in the training set, apply it to the validation set, and below n = 10 report directional consistency instead.
I reran clustering with identical parameters and the subtypes changed. Why?
Do not blame the seed first. In a real case the adjusted Rand index was only 0.19, near random. The root cause was contaminated feature selection: genes were ranked on a matrix that still contained outliers, and the outlier samples were removed only afterwards. The correct order is remove samples, then select features, then cluster.
Why does R abort without warning on 100,000-cell cell-communication analysis?
Memory overflow. CellChat converts the sparse matrix to a dense one, needing roughly cells times genes times 8 bytes: 100,000 by 20,000 is about 16 GB, and the R session aborts with no message. Fix: downsample each cell type to 500–1,000 cells.
I only got 12 differential genes. Is the dataset unusable?
Not necessarily. Pathway analysis uses whole-genome ranking and does not depend on the differential-expression threshold; in this case 14 Hallmark pathways were still significant at a false discovery rate below 0.05. Few differential genes plus a strong pathway signal typically indicates high within-group heterogeneity.
My pre-registered thresholds all failed but the AI kept going. How do I prevent that?
Make the gates executable validators rather than prompt text: force the FAIL branch and block through an exit code. In a real incident all three metrics failed (classifier area under the curve 0.397, below the random line) yet the report said "partially robust" and three more phases ran.
My result was significant until I controlled for a confounder. Now what?
This is the problem you most want to find yourself rather than hear from a reviewer. A real number: one round of trajectory analysis passed its gate on all three methods, but after controlling for proliferation state one method's rho fell from 0.578 to 0.086 — it had been tracking a proliferation gradient, not the hypothesised maturation state. Make confounder sensitivity analysis a mandatory design-stage check for key conclusions. Common confounders: proliferation state, cell cycle, sequencing depth, sex, batch, age.
The target gene is blank — is the platform broken or is there really no signal?
Look at the positive controls. In a real case, across the same batch of ROIs three positive controls detected at 68%, 53% and 48% while the target gene was at 0% — the platform was fine, the signal genuinely was not there. That is what positive controls buy you: separating technical failure from biological negativity, and saving weeks of troubleshooting. Specify controls and their pass threshold at the design stage.
IHC shows the protein but the transcriptome detects no mRNA. How should I word it?
Write "mRNA below detection limit", not "not expressed". Below the limit of quantification you can only say this platform at this depth did not detect it; protein half-lives are also far longer than mRNA half-lives, so the two being out of step is normal. State the detection limit and sequencing depth in the methods — reviewers know the difference between these two claims.
Why does my code break on a different machine?
You are not alone. A practitioner who reviews code reported looking at around 200 pipelines with perhaps 15 genuinely reproducible (248 upvotes); another comment at 73 upvotes named the cause: nobody teaches bioinformaticians software engineering properly, to the point that hardcoded paths are not even recognised as a problem. The fix is not to study software engineering first, but to have the project structure, exportable environment declaration and automatic parameter and version records enforced by the framework.
Does merging public datasets as replicates make results more robust?
No — it makes them less trustworthy. Sequencing platforms, library preparation and sample handling differ between studies, and the batch effect this introduces is often an order of magnitude larger than the biological difference you are after. The practice was explicitly criticised in community discussion (52 upvotes). Do batch correction with before-and-after diagnostics and state each dataset's origin and processing in the methods.
I found out three months in that the study cannot work. How do I learn that sooner?
Move feasibility to day one: do positive controls come through, is the target signal above the detection limit, is the sample size sufficient for the expected effect. In a real case the numbers — 0% detection with positive controls normal — were available on day one but not faced until month three. The design should state what conditions stop the study, as an executable verdict rather than a private expectation.
The paper says the data is public — why can I not download it?
"Public" and "directly downloadable" are different things. Of four candidate datasets in one feasibility pre-search, access status was controlled, controlled, view-in-place only, and genuinely open — one of four. So data accessibility belongs at the first gate of the design rather than the last step, and it should be verified over the live network rather than assumed from memory.
Every topic direction I searched has already been published. What now?
Change the causal direction rather than the keywords. In a real case six concrete entry points had all been systematically covered; the way out was to stop asking "what causes this disease" (exposure to outcome) and ask "what does this disease cause" (the reverse causal chain), which often opens a genuinely unoccupied window. Duplicate checking also has to cover meta-analysis-equivalent formats such as network meta-analyses and pre-specified subgroup analyses.
One gene has a suspiciously high fold change. Key finding or false positive?
Check whether it is mitochondrially encoded first. In a real case a gene showed a log fold change of 4.97 against a runner-up at 2.15 — it was a known quantification bias for the circular mitochondrial genome. The more insidious part: the filtering code existed but matched zero genes because of a case mismatch. Use case-insensitive patterns with multi-pattern coverage, and always check the match count after filtering.
Why is my conda-installed GPU tool hundreds of times slower than expected?
You probably installed a CPU or OpenCL build. conda install can resolve to a non-CUDA variant that runs about 700 times slower on NVIDIA hardware, and you may not notice for hours. The same problem is common with scvi-tools, cellbender and RAPIDS. Run a 5% probe right after installation and alert on abnormal speed.
Can I trust throughput numbers computed from total elapsed time?
No. In a real case throughput derived from wall-clock time came out 50 times lower than reality; the tool's own log showed performance was completely normal — the host had gone to sleep repeatedly during a long run. Read the tool's self-reported metric and distinguish CPU time from wall time.
Did all of these really happen?
Yes. All come from real analysis and development environment records, de-identified: no specific dataset accessions, journal names or identifiable study details. The numbers (50 minutes, adjusted Rand index 0.19, area under the curve 0.397, 700-fold, 16 GB) are measured values.
How do I try the platform, and how do I buy it?
The personal edition is $50 on Gumroad; the enterprise edition is $300 on Gumroad, multi-server or site licensing by email. See the purchase section.
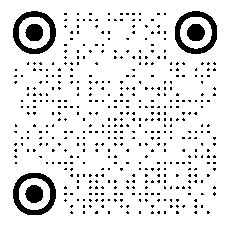
The 35 entries here are the written-up ones. The day-to-day findings — a tool version that changed under us, an error postmortem, how to answer a particular reviewer, why a parameter is set the way it is — go up on Xiaohongshu (RED) as they happen, more often than this page is revised. Scan to follow. Note that posts there are in Chinese.
Last updated: